Data
In this menu you can select a dataset that you want to analyze within the UMAP menu (
).
Once you have chosen a dataset, make sure you click "Load" in order to make
it available in the UMAP menu. After you loaded a dataset, a brief description
of the dataset with regard to its experimental details as well as a preview of the UMAP embedding is shown. You are now set
up to explorer the selected dataset with GutTubeR.

UMAP
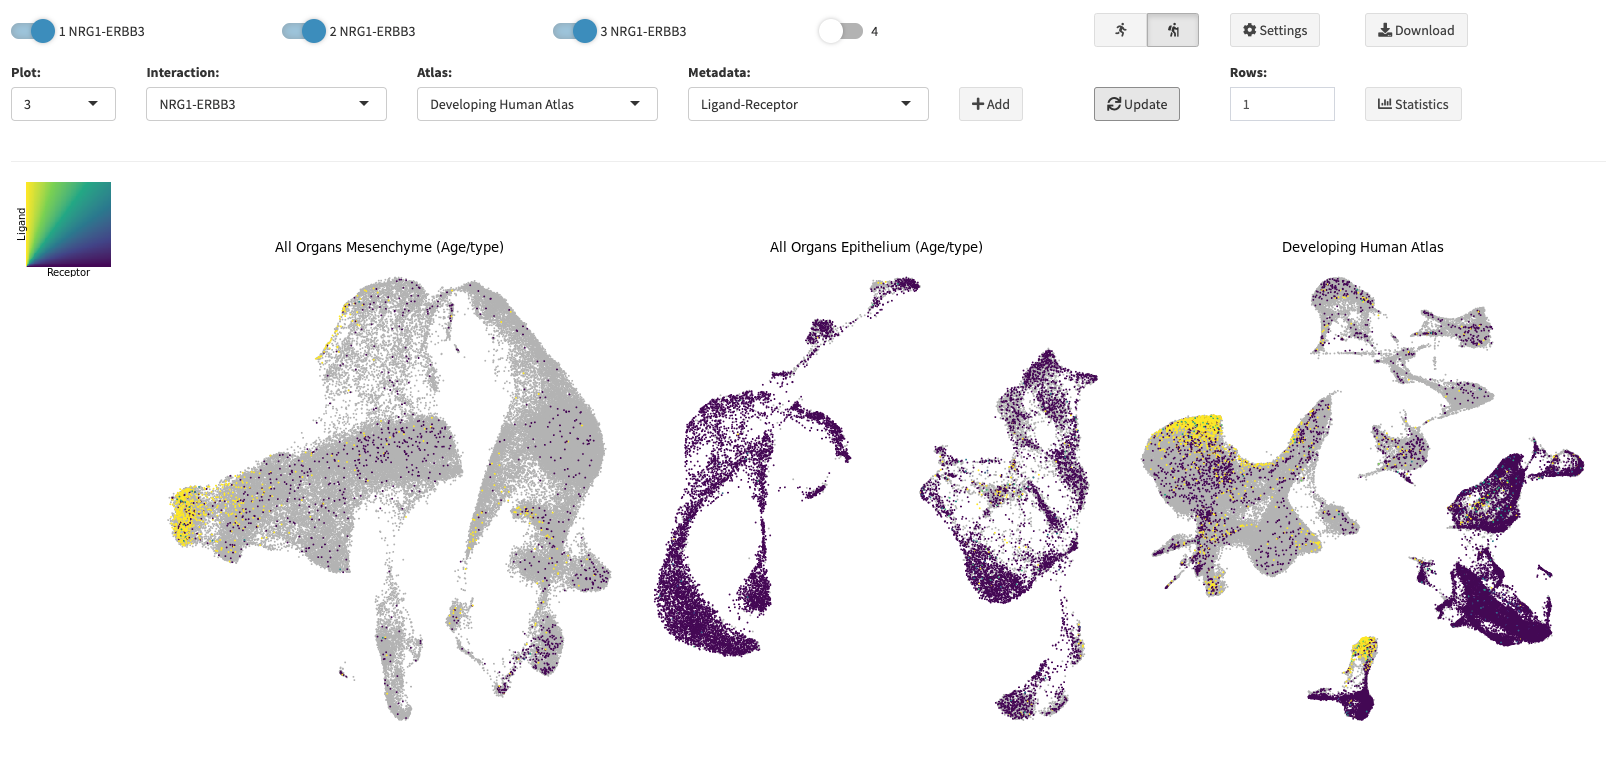
In this menu you can create UMAPs of the selected dataset in a dynamic fashion. First, select how many plots you want to create
by activating up to four plots with the switches at the top. After having done so, you can select the meta annotations for the corresponding
UMAPs from a drop-down menu. Note, if you want to annotate gene expression, just type and search for your gene of interest in the
selection field. You can also filter grouping annotations by selecting multiple groups from the filter selection menu. After having chosen a annotation click the Add button (
).
Proceed like this for all activated plots. Once you set all the annotations you want to plot, click the Update button (
) and your UMAPs will be rendered.
Note, that when clicking the Add button (
) the corresponding plot will be created
with the current settings and it will overwrite existing annotations for that plot.
Adjusting settings (
) later on will just affect newly added plots. This allows you to select for example different color scales for gene
expression on the same UMAP or load and compare other datasets to already created UMAPs from different datasets. You can download the plots you created by clicking the Download button
(
) with the set download parameters.


Performance
Some of the available datasets are rather huge which leads to increased plotting time. When you encounter such behavior, you can activate the
performance mode (
). When activated the selected dataset is sampled before creating the UMAP, which reduces overplotting and plotting time.
The applied sampling rate can be adjusted in the settings (
). By default the performance mode is activated (
) when the selected dataset exceeds 150,000 cells otherwise
it is deactivated (
).
Statistics
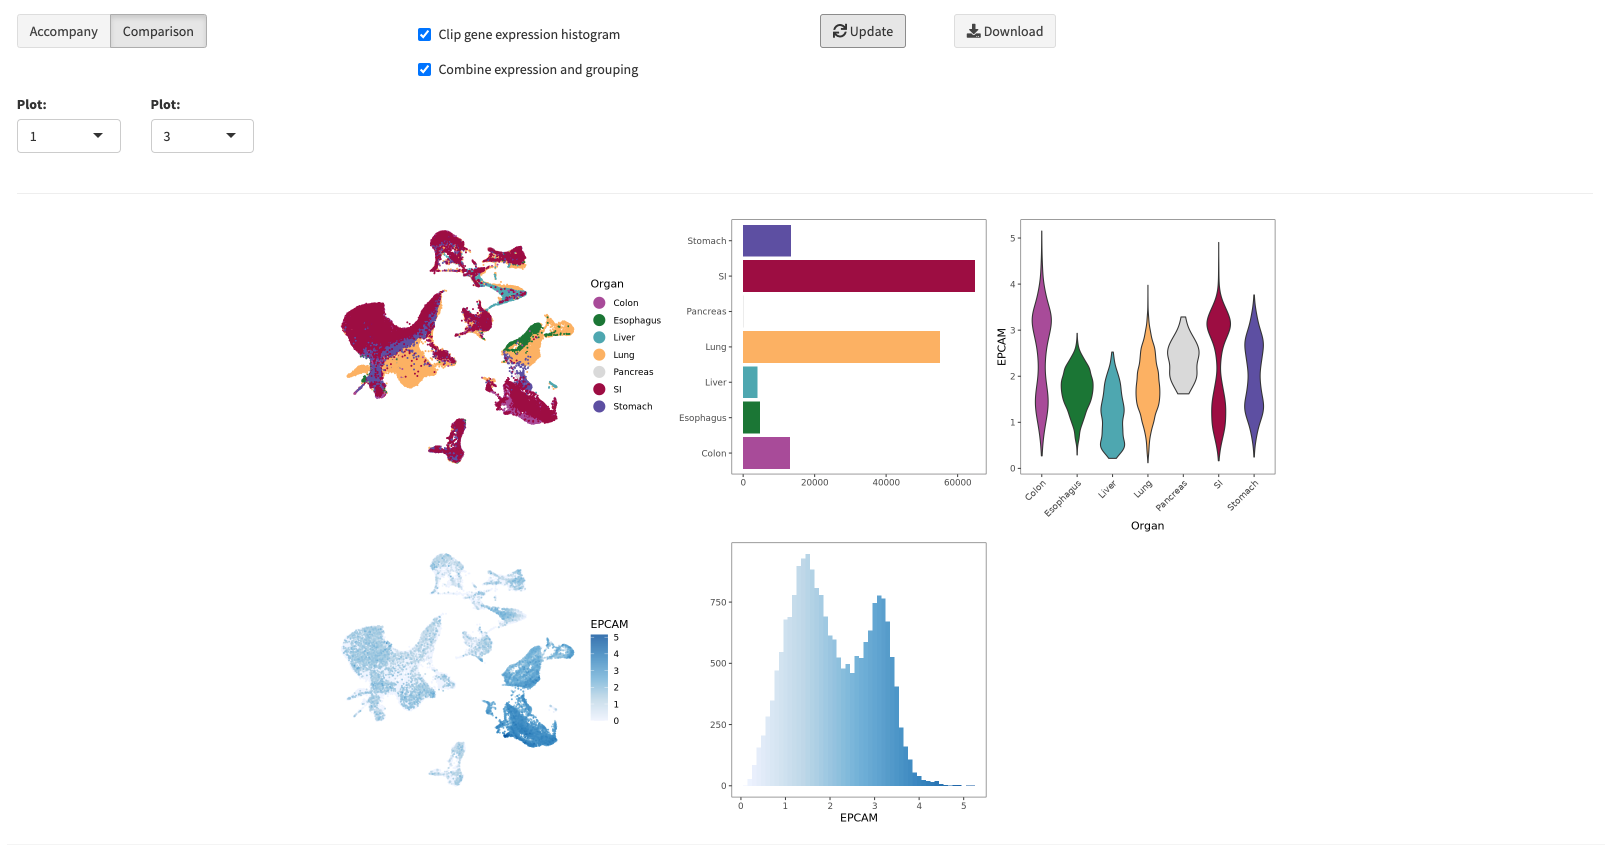
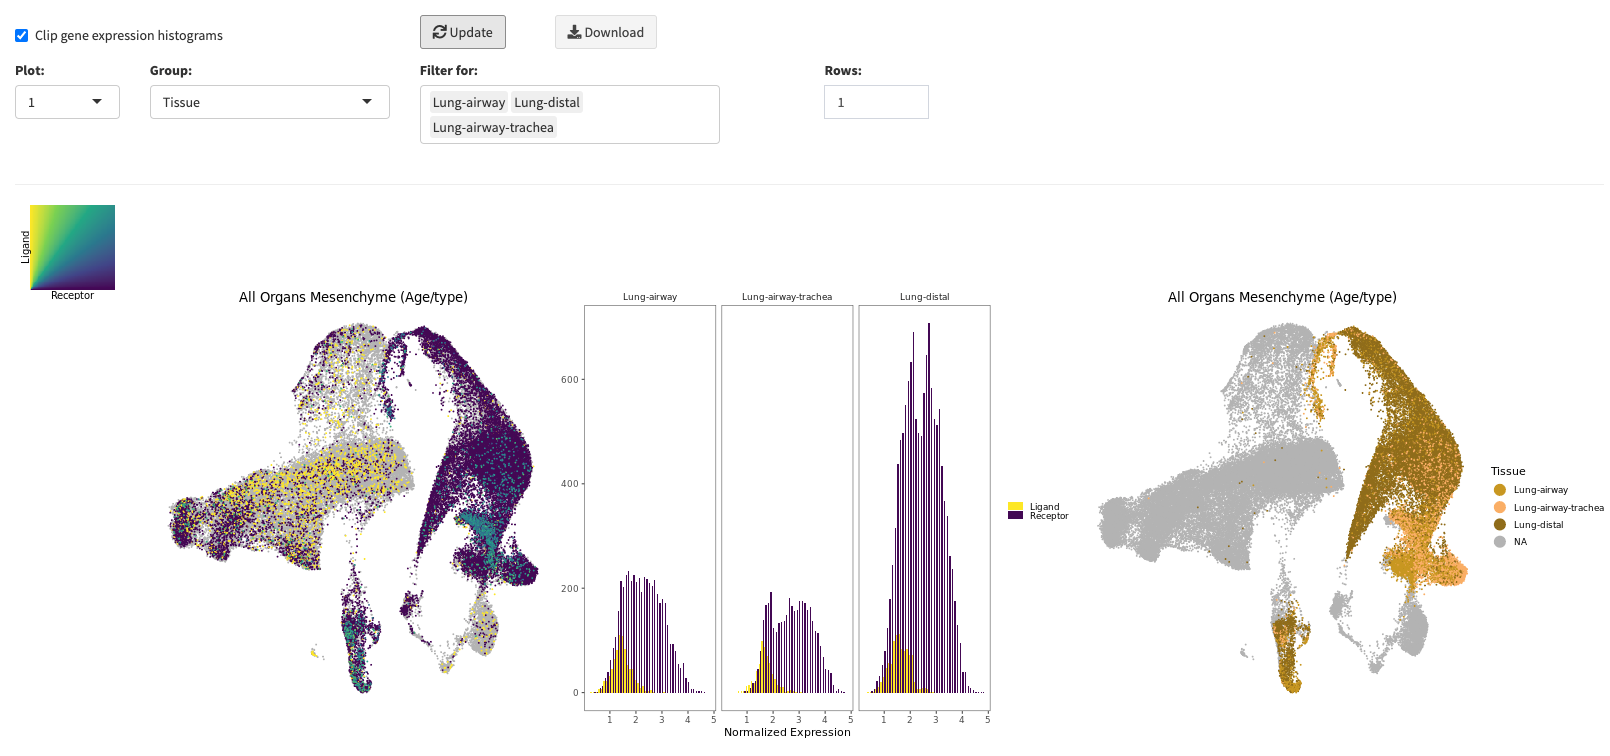
The statistics pop-up window allows you to plot underlying distributions of your created UMAPS. You can either accompany a selected UMAP with a distribution
for its selected annotation or compare two UMAPs and their corresponding distributions. Note, that when you select a UMAPs with a discrete mapping and
a gene expression mapping, a combined violine plot will be created showing the gene expression grouped by the selected discrete meta annotation.
In many cases, it makes sense to filter the gene expression values for not expressed genes. You can toggle this with the clip gene expression histogram option.
You can download the displayed distribution plots by clicking the Download button (
). Here the same download parameters apply as for the UMAP section (
)

Settings
In the settings menu you can specify options for plotting and downloading. The chosen settings apply for the main UMAP plotting functionality (
)
as well as for the statistics menu (
). By now you can choose a color scale for continous colormapping (blues and viridis color palettes) of gene expression, set the point size and set the sampling rate (0.1 - 1) which is
applied when the performance mode (
) is activated. Apart from this you can specify aspect ratio, unit, resolution and format parameters for downloading (
) the created UMAPs and distribution plots
as an image file.


